Usability Testing Synthesis
There are two main avenues to analysing results from testing:
- Qualitative
- Quantitative
Qualitative synthesis is looking at the things that were said and organising them into broad categories
This is the more common way to analyse results, and can be done in a similar way as you did with your user research
Quantitative analyses is measuring how much things were said, or done
There are two methods we’ll look at:
- Traffic Light analysis
- Rainbow charts
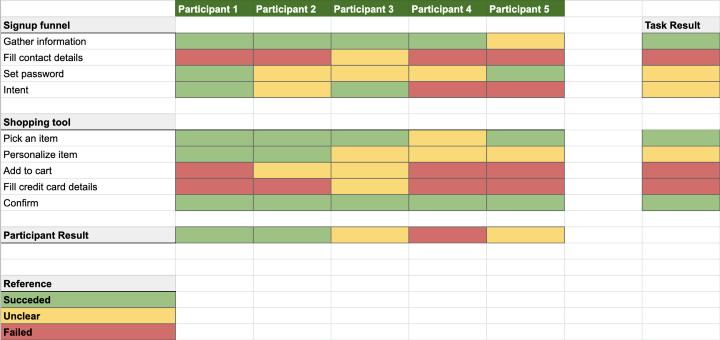
Traffic Light Analysis
Create a spreadsheet or table with tasks you asked the users to complete as rows; and participants as columns
Mark whether the user:
- Completed the task
- Struggled with the task
- Did not complete the task
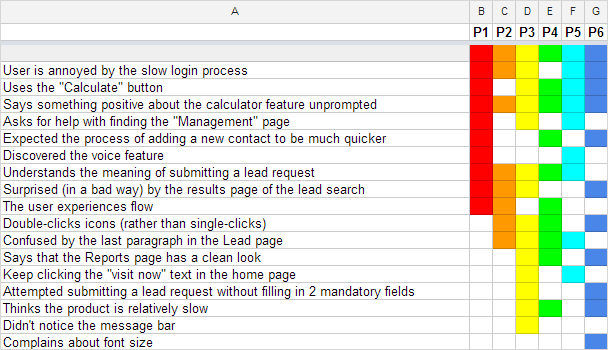
Rainbow Charts
On a spreadsheet, list observations in rows, and participants in columns. Where an observation occurs, mark the cell, giving each participant a different colour.